
Power BI vs Tableau Cost Calculator
Need to know how Power BI compared to Tableau in terms of the cost to your business?
We put together this calculator for you to get a definitive answer to whether Power BI or Tableau is the more cost effective solution.
Power BI and Tableau are two of the most popular business intelligence (BI) and data analytics tool in the market. According to Gartner's Magic Quadrant 2021 for analytics and BI tools, Power BI and Tableau are the two leaders in terms of the completeness of vision and ability to execute. There are many other BI tools out there which may be more suitable for its specific niche market, but Power BI and Tableau are by far, more than capable tools to take on your requirements.
Whether you are a small business owner, non-profit organizations, enterprise, you would definitely want to find out how you can have better business intelligence and leverage on data analysis using one of these tools.
We are going to compare Power BI and Tableau in the key significant consideration factors: (1) connection to data sources, (2) analytics language, (3) security, (4) pricing, (5) sharing and collaboration, (6) updates and (7) other considerations.
If you only need to know how Power BI compared to Tableau in terms of the cost, we have put together this price calculator so that it can give you a definitive answer to whether Power BI or Tableau is the more cost effective solution. This is better than a standalone Power BI price calculator or Tableau price calculator because we make it easy to compare the two most popular solutions.
How affordable are Power BI and Tableau?
Power BI and Tableau offers different tiers in their licensing to suit different requirements. For most businesses, when they are starting out, they want to explore how beneficial the business intelligence tools are. They might take a few months to evaluate the tool and therefore the first question on most people's mind is does it cost anything to start?
Is Power BI free to use?
Yes! Microsoft Power BI is free for you to use and explore. Simply download Microsoft Power BI desktop and you can start doing most of the things you need to do with Power BI. You do not even need to provide your email address.
Is Tableau free free to use ?
Tableau is also free to start, but it requires you to sign up with an email address before you can download a free 14-day trial. You will then install Tableau desktop and play around with the tool and its features. After the 14 days, you will be required to pay for one of their plans to continue using. If you are a student or teacher, you can sign up and get a free 1-year license.
Pricing Tiers
Power BI - Pro, Premium Per User and Premium Capacity
Power BI is free to start, but the Power BI Pro license is available at a flat fee of $9.99 per user per month, whereas Tableau has a range of prices from $12 to $70 per user per month depending on the license type.
You can start using Power BI Pro with a free trial that lasts
Power BI also offers Power BI Premium, which provides dedicated capacities with different capacity nodes in their EM and P SKU families. These allows you dedicated capacity which is not shared with other organizations if you require such dedicated resources such as a specific number of processing cores and RAM.
Changes in 2021 to Power BI Premium
One of the latest changes Microsoft introduced for Power BI pricing in 2021 was the Premium Per User license. The Power BI Premium Per User license costs $20 per user per month, and gives you additional AI capabilities and increased dataset size. This will greatly benefit users who are doing more advanced data analytics, without needing to fork out the money for a Power BI Premium capacity which starts at $4,995 per P1 node.
A single P1 node would cost $4,995 per month for theoretically unlimited users, though it is recommended to limit to 1000 users per Premium node. For much larger organizations, they can purchase additional nodes to add more capacity. This makes it extremely affordable at only $5 per user per month.
However, for most cases, it would be sufficient for a business to stick to the Power BI Pro license.
Tableau - Creator, Explorer and Viewer
Tableau has pricing for 3 different user types: Creator, Explorer, and Viewer. It comes with a base minimum number of user requirements for Explorer and Viewer at 5 users and 100 users, respectively. Immediately, it is out of reach for those smaller businesses with less than 100 employees.
Even if a small business meets the bare requirements for the number of users, it would add up at a minimum of $1,780 per month or slightly over $21k annually. Tableau further complicates the pricing for any organizations with the additional add-ons for data management feature at $5.50/user/month and Resource Blocks at $250/block/month. This makes adopting it from a cost perspective very confusing due to the many different variables involved.
In most cases, Power BI will still come out cheaper than Tableau, both at the per user level and at the organization level. There are also many ways that users can use the free version of Power BI desktop within the organization, even though there will be many limitations on collaboration, sharing and security. We all know that pricing is a huge factor for the management to consider.
To me, for Power BI vs Tableau licensing tier, Power BI wins hands down with a clear pricing and less planning is required to provision for licenses. However, I wish that Power BI had a cheaper tier below Power BI Pro for those viewing the shared dashboards and reports. This would greatly enhance the competitiveness of the product.
*All prices above are stated in US Dollars (USD). This pricing is subjected to changes, and it is up to date according to the time of research of publishing this article. Please refer to their respective pricing pages for the latest information.
Connections to Data Sources
The key to all these business intelligence tools is the ability to bring together all the data before it can even analyze it and present it in how you want. Therefore, its connection to data sources is critical before you can do any form of data analytics.
Both services can connect natively to a wide variety of sources. Most of them are the same, but there are some which seems exclusive to either Power BI or Tableau. An example would Splunk, which is only available on Tableau based on their support page. However, we manage to find a third-party connector which can connect Power BI to Splunk.
Power BI can connect to a wider variety of its Microsoft-related Azure products such as Data Explorer, Data Lake Storage and many others. This is comparatively more than Tableau, which can only connect to Azure SQL Synapse Analytics. If you are using the more popular databases, you are in excellent hands on either platform.
Data Preparation
Data preparation is one of the most tedious task when it comes to any data analytics project. Having everything within one software makes it easily available and that's where Power BI shines. Power BI allows you to data prep from the same Power BI desktop which you later use to create your dashboards and reports. You will perform all Extract, Transform and Load operations in Power BI Desktop.
However, Tableau requires you to use a different software called Tableau Prep to combine, shape and clean your data for use. While it may not be that difficult to do on two software, it leaves much to be desired for an efficient process flow. Therefore, many users tend to prefer using Power BI compared to Tableau to prepare their business data for analysis.
Analytics Language
Power BI uses M language and DAX (Data Analysis Expressions). M language is used to pre-process the data before DAX is used to analyze it. They have certain similarities to Excel. This can make learning relatively easier, but DAX is extremely powerful in ways of its contextual and relationship analysis which could not be done effectively within Excel itself. However, having these two languages could make it confusing for some users as they are not exactly the same.
Tableau uses what they call MDX (Multidimensional Expressions) which is a query language for OLAP (Online Analytical Processing) databases. MDX is generally a bit more complex compared to DAX expressions. For example, to create a measure which filters by a specific date, it would be expressed as shown below.
MDX: [Date].[Day of Week].currentmember IS [Date].[Day of Week].[Sunday] ”
DAX: 'Date'[Day Name Of Week]="Sunday"
DAX will allow you to write in much simpler and shorter forms, which says a lot about the development of DAX language. It is also capable of super advanced multidimensional calculations.
R and Python in Power BI and Tableau
For the more advanced data scientists, both Power BI and Tableau can utilise R and Python to run advanced data science statistical and predictive models. Learning either DAX or MDX is like learning different programming languages, they have their unique syntax which you must get used to. However, if you are coming from a purely Excel background, you may find yourself a little more comfortable in DAX territory.
In terms of performance, DAX is mostly faster to process than MDX. For majority of use cases, you may not notice an enormous difference, but for large datasets that is where the difference may start to show.
Beautiful Visualizations
Both Power BI and Tableau have a wide range of visualizations which can be used to provide great story-telling for your business intelligence requirements. Tableau and Power BI both have the basic bar, line graphs, scatter plots, maps etc. Therefore, it would more than suit the needs of most organizations.
In Power BI, you will use Power BI desktop to start creating your reports before publishing it to your workspace. You drag and drop the different measures and metrics into the desired visuals, and you can customize many different aspects such as the colors, line, font, font size etc. In addition, you can create different shapes, narratives, add buttons and sync slicers to improve the interactivity of the Power BI dashboard.
Power BI offers some really fancy ways which you can design your dashboards, including using different bookmarks to create different effects when you click on any elements of the dashboard page. If you require custom visualizations, you can always check out other Power BI visuals available on the AppSource, or create your own using a hidden secret, Charticulator.
In Tableau, you will use the Tableau Desktop to create the dashboards and reports. From there, you will similarly drag and drop the different dimensions and measures into the charts, and customize the color, size etc. You can also add more visuals from Tableau Viz Gallery, or create your own custom visuals.
Both Tableau and Power BI are really great in terms of the ease of use of creating beautiful visualizations to present the data in a meaningful and insightful manner.
Security
Apart from the user logins and authentication, both Power BI and Tableau provides Row Level Security (RLS) which restricts the rows of data a certain user can see in a workbook. This can be set by defining the user roles and groups when building the reports and dashboards.
For example, sales orders may be aggregated across different locations for management to view. However, we can restrict the sales manager at a particular outlet view only the sales orders at their location. The admin will need to assign the specific roles and tag the right users to the various roles in order to limit their access and apply the RLS.
Power BI allows you to specify the isolation level that defines how one data source must be isolated from other data sources. Private, Organizational and Public data sources can be defined to keep the sensitive or confidential information segregated to only authorized users. This will be configured when building up the Power BI reports and dashboards. It also provides the relevant warnings when trying to merge data sources so that security will not be compromised.
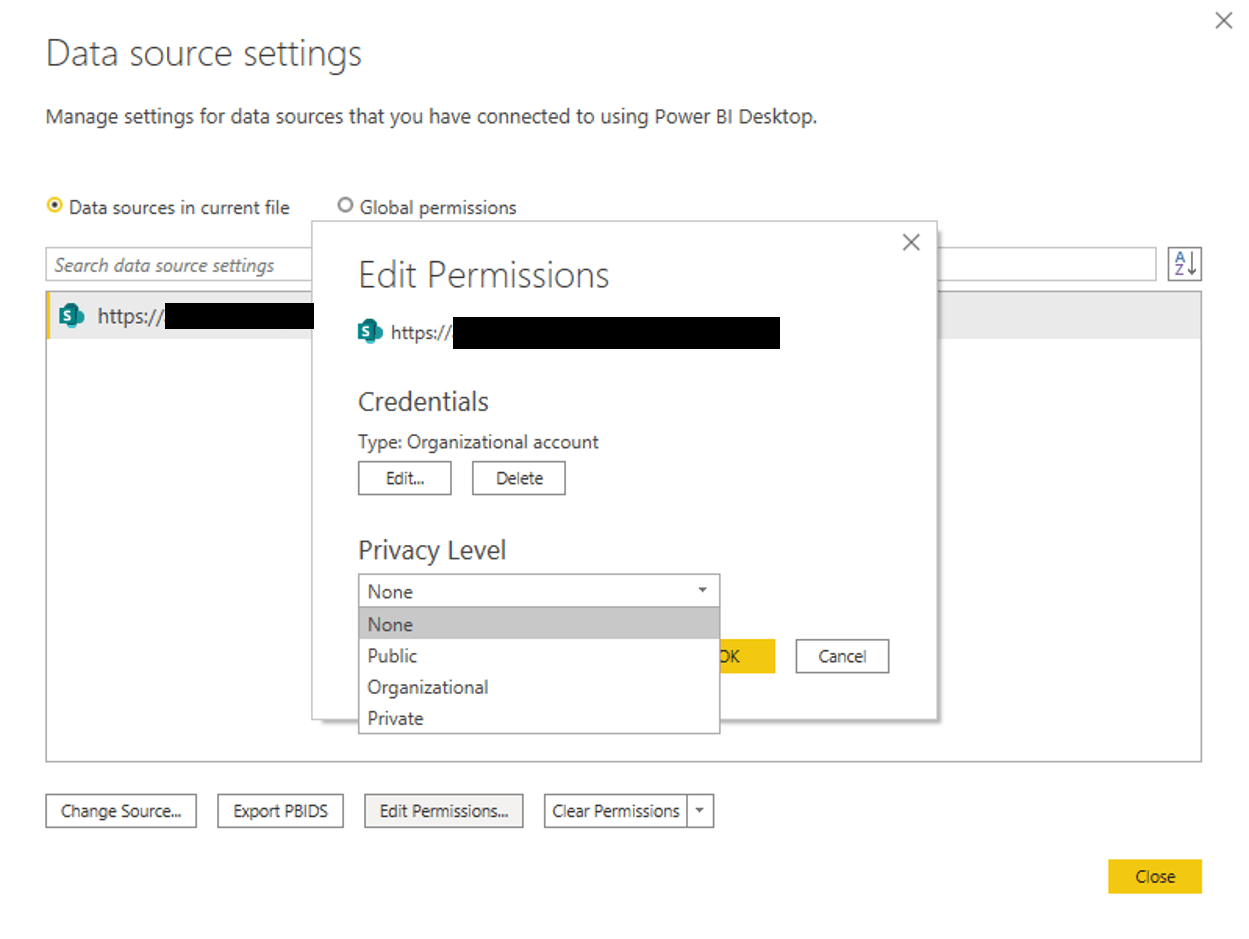
Data source permission settings in Power BI - None, Public, Organizational, Private
However, this is not seen in Tableau, which I think is a very useful feature in the generalization of data into three simple categories that makes data management and security more easy.
When publishing the report, you can also restrict users from being able to modify the report or download the data.
Sharing and Collaboration
Power BI and Tableau provides very similar sharing options and similar interface. The basic of sharing includes selecting the users and sending them a message and clicking on the share button. They both allow for comments on the dashboards which is a very important collaboration feature as it allows for people to question the data or suggest improvements to make the dashboard better.
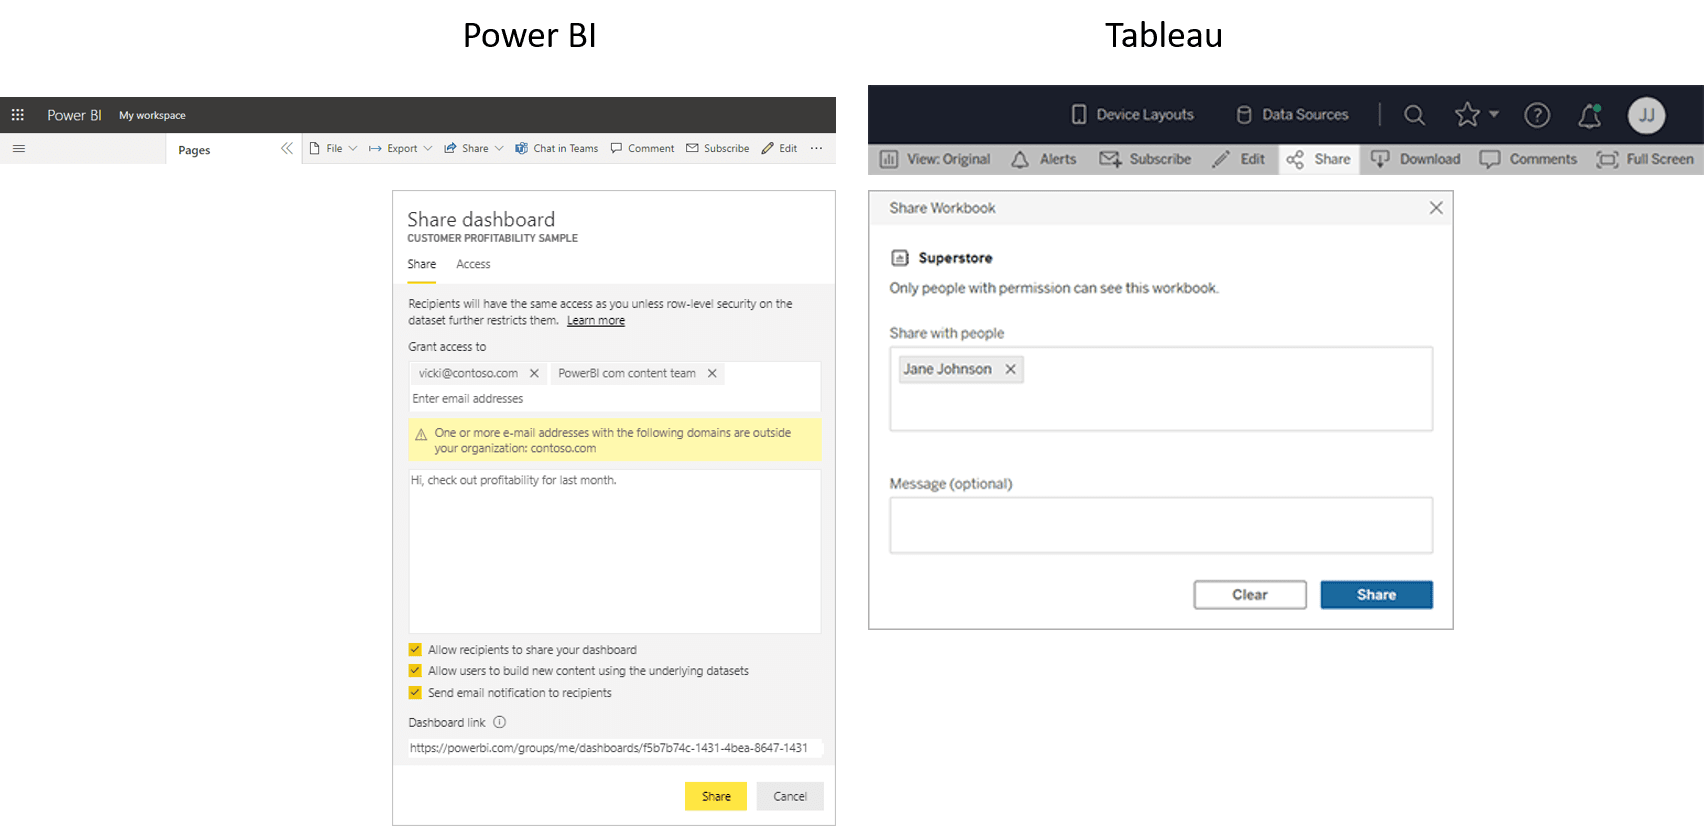
Sharing interface for both Power BI and Tableau are relatively similar
Tableau limits certain collaboration features to the Creator and Explorer tiers. The basic Viewer account could not create subscriptions by themselves, nor will they be able to create data-driven alerts. It will also prevent them from downloading full data. Tableau makes it relatively easy to publish online to the web for public preview, but a Viewer account cannot do so.
This limits the ability for an employee to configure the alerts that he needs for his purposes, which should not be the case since the data is democratized and made available for his viewing. This limitation is definitely not favorable to long-term collaboration and hopefully Tableau would consider changing this in the future.
Power BI does not restrict any of these, but allows the admin to provide finer security control of what the specific user can do.
Updates
Power BI has been getting regular updates to its features and performance. You can see this through their monthly blogs and video updates via YouTube to the consumers. This is an excellent commitment to their customer base, and helps keep the product feeling refreshed. For example, I was really happy with one of the updates in Power BI which was the ability to customize themes properly, because previously if you wanted a dark background theme, it was tedious to do so because opening up the visual card would render it back on a white background. They have also released many quality-of-life improvements which makes creating dashboards and Power BI reports that much easier.
Tableau releases updates only roughly about once every quarter, which is three times less than Power BI. This is based on their updates in the last 2 years. It is also not on a fixed schedule, and it makes checking in on updated features a little disappointing.
Other Considerations
Tableau was acquired by Salesforce back in Aug 2019, which meant that a large user base already in Salesforce might prefer to be plugged into the Tableau ecosystem. Power BI as part of the Microsoft 365 ecosystem (previously Office 365) would also have a huge user base. This might be a strong consideration for many as the ecosystem they are in could largely determine ease of use as there is no need for multiple account logins to different systems.
Artificial Intelligence
The buzzwords these days around machine learning and artificial intelligence cannot be ignored. Does Power BI and Tableau consist of any artificial intelligence features? Lets take a look.
Power BI AI Features
Power BI has embedded quite a number of artificial intelligence features, whether it is behind the scenes to improve performance, or upfront for forecasting and analytics.
Automatic aggregations of data tables within Power BI Premium dataset is as Microsoft puts it "self-learning, self-optimizing, AI-driven system. This helps users to better analyze massive datasets and boost performance for data analytics. It is going to be available in July 2021 in public preview.
For data visualizations, there is a visual available called Key Influencers which is AI powered. It is free and helps users to understand how different metrics are affected by different factors. You can easily include the visualization into any Power BI report and it works together when you filter or interact with other elements on the same report.
Tableau is using AI to create visuals that are more intuitive and interactive.
Microsoft has been investing heavily in machine learning technology, as well as powering their data scientists with the latest tools for building intelligent models. Machine Learning can provide insights on a scale never before possible by applying powerful computational power to massive amounts of unstructured data. The potential here is immense but time will tell where these technologies take us next.*
*Footnote about Artificial Intelligence: Microsoft's investment into this field may help them continue moving forward when it comes to artificial intelligence and new developments in the future; however, Tableau has also made investments in this area which could make its platform superior if they have put together an expert team there or just invested better
Conclusion: Is Power BI better than Tableau?
Without a doubt, from the free version to how easy it is for users to get started, Power BI is the better solution for organizations to get started. You can evaluate the solution and use proof-of-concepts to get up and running quickly.
Whether is it for enterprise users or small business owners, building dashboards with Power BI is the way to go. Microsoft has done an excellent job in trying to streamline their ecosystem and make everything super easy to access while maintaining security.
If you are used to Microsoft Office, you will find much ease with Power BI as your choice of analytics platform to bring together your business data.
I would say that Power BI is such an incredibly powerful tool and I think that it’s still at its infancy stage despite being an awesome product. Just like how Excel has been extremely useful for many power users, Power BI offers a whole lot for users and organizations to enhance their business intelligence at their workplace.
Tableau is still a popular tool, and it might produce really pretty looking visualizations for certain users, but I do not see any significant advantage that Tableau has over Power BI, especially since the cost makes it generally prohibitive to even consider Tableau.
This is why we still recommend Power BI to our clients, with the ability to quickly build a proof-of-concept for them to explore and decide if this is the direction for them to go into.